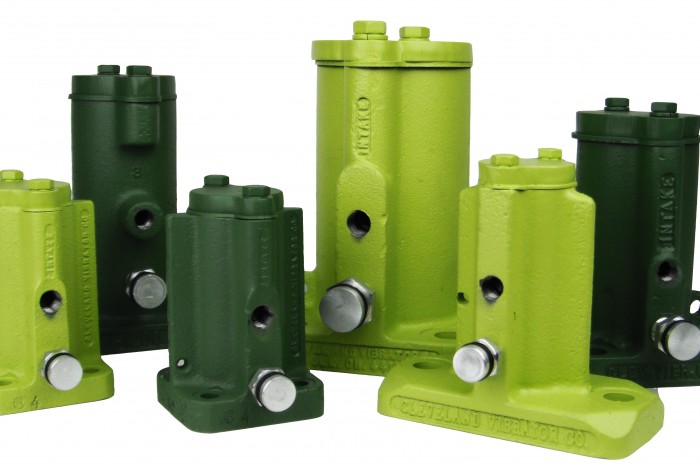
Vibrator performance, force output, frequency, energy consumption and noise, all parameters that are of interest to our customer to some degree or another. At one end the spectrum we might have a plant maintenance supervisor who simply needs a vibrator as a flow aid on a hopper and isn’t particularly interested in the exact operating frequency and force output of the unit, just needs something that works, solves the problem. On the other end of the customer range is the user who wants to know force and energy consumption at a specific frequency. Vibrator sizing on hoppers as a flow aid is driven by the physical characteristics of the hopper and the material stored in that hopper. Jack Steinbuch has covered this topic, if you’re looking for more specifics please refer to jack’s blog on the topic. Providing performance data for the more precise and scientific customer can be a bit of a challenge.
When I started working at Cleveland Vibrator I inherited a file with performance data tables and graphs for the majority of our Air Piston Vibrator line. Some of these performance graphs go back to the 70’s and 80’s. Cleveland Vibrator had some pretty sharp folks working for the company back then, hopefully that is still the case today! Regardless, it’s probably time to use a bit of current technology to update the information we have on our core product, air piston vibrators.
For a number of years now we’ve had a very nice functional accelerometer and meter that we use during our final testing of Fabricated Equipment. In the quotation and design of equipment, whether we’re talking about Vibratory Screeners, Feeders, or Compaction Tables, we always have a target for the “g’s” of the unit. The ratio of the vibrating weight to force output of the vibrators (g’s) affects the ability of the screener to work effectively, changes the volume of material we can move on a feeder and influences the results of a vibratory compaction table. So we always design to this important parameter and test the final unit to make sure that what our 3D computer model predicts and the resulting real world equipment are a close match in terms of acceleration – “g’s”. Since about 95% or more of our equipment utilizes Rotary Electric Vibrators for the source of the vibratory force we have no problems measuring the g’s. When we mount two rotary electric vibrators on a piece of equipment and counter rotate them, the resulting force output is a very nice sinusoidal wave signal as the vibrators synchronize and give us linear motion. Perfect for our instrument’s capabilities, it provides us with the data we need. (See this in action on our YouTube Channel here!)
But what about testing and recording data on our air piston vibrators? Here’s where we start to see the limitations of our current data acquisition equipment. If we break the air piston vibrator line into two basic groups, impact and air cushioned, we have difficulties with recording data on the impact vibrators. Due to the design of the air cushioned units, we actually capture a volume of air between the end of the piston and the cap or base during the stroke of the piston, this decelerates the piston as it nears the end of the stroke, preventing a metal on metal impact. This deceleration results in a sinusoidal wave form similar to what we see with the rotary electric units and our equipment. It’s pretty easy to record the weight of the vibrator and a test bed, attach our accelerometer and record the gs. Using Newton’s second law of motion, F=ma, we calculate the force of the vibrator with a known mass and the recorded acceleration of that mass. Works great with our equipment and for the air cushioned piston vibrator. The problem comes in when we try to do that with our impact vibrators. Due to the “strike” of the piston on the base of the vibrator or the mounting plate, we get a metal on metal impact and a resulting “saw tooth” type of output wave. Our simple test instrument can’t handle that type of signal.
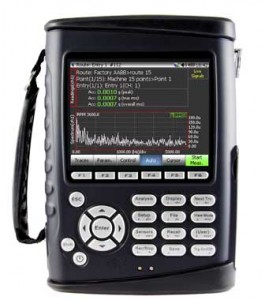
Over the years I’ve periodically searched for a more sophisticated data collection instrument that would allow us to capture the impact of the piston and better document what’s actually happening during the cycle of the vibrator. Most of the smaller hand held test instruments you run across online are designed as preventative maintenance tools, looking at vibration produced by bearing wear on motors or other rotating equipment, these instruments are similar to our current test instrument. Given our budget, it seemed like this would be our only option, preventing us from getting good data on the pneumatic impact piston product line. While searching for other options I came across Crystal Instruments and their Coco-80 Dynamic Signal Analyzer. From information on their website it looked like this might be a viable option for our testing. I got in touch with the local representative and was fortunate enough to have a member of Crystal Instruments sales team do an onsite visit and demo of the CoCo-80. The in-house demo showed the capability of the CoCo-80 to gather all the data I wanted and then some. Cleveland Vibrator purchased the Coco 80 Dynamic Signal Analyzer and I’ve begun to do testing with this instrument, it will be an integral part of our documentation of the air vibrator product line.
Sometimes with more data you start to generate more questions. I’ve just begun to work with the CoCo-80 System, some quick tests to familiarize myself with the capabilities of the instrument, how do I measure frequency, change from acceleration to displacement, how does the data change when I change the sampling rate? I’ve done some testing on the VM-25, miniature impact vibrator. I mounted the VM-25 to an isolated test plate weighing just over 20 pounds and recorded the acceleration of the table due to the strike of the piston on the mounting head of the vibrator as it was transmitted to the test plate. As I increased the sampling frequency, the instrument was able to record the near instantaneous impact of the vibrator piston with the end head. For a small piston I was surprised to be recording nearly 3 g’s of acceleration at 80 psi! Using the F=ma equation, this would suggest that the force output of the VM-25 is over 60 pounds of force. Sorry, I can’t quite buy that one; we’ve rated the force output of the VM-25 at 15 pounds of force since well before I started working here. So what are we seeing and capturing? And equally important what performance data do our customers need for our pneumatic vibrators? What “numbers” are meaningful in solving their problems?
This week I had a salesman from an accelerometer manufacturer in to look at options for the sensor I’m using with the CoCo-80. The guy’s a wealth of knowledge, over 30 years’ experience in data acquisition. He said that a lot of folks don’t understand the very high level of acceleration you can see with a metal on metal impact, a great way to destroy an accelerometer! So I’m thinking that the force generated due to the impact of the VM-25 piston running at 15,550 vibrations per minute which results in 3 g’s acceleration isn’t going to be a useful number for most end users. Sure it’s accurate but is it helpful? It’s a bit of “back to the drawing board” for me on this one. What to do with the data; acceleration, displacement, and frequency, making some mathematical relationships and come up with a meaningful number for the force output of the vibrator. It’s an interesting challenge. In an industry that to great extent works on the “close enough for horseshoes and hand grenades” theory, precise data may not be important to 95% of the customers, they just want it to work. Cleveland Vibrator is focused on providing the right vibrator for the widest possible range of applications. Providing our staff with the best tools and data available to successfully provide solutions to our customers is one of the main functions of our engineering staff.
The current plan is to set up and test the complete line of air cushioned and impact pneumatic vibrators over the next couple of months. We’ll collection data on operating frequency, air consumption, noise levels and acceleration at a variety of inlet air pressures. It should be interesting to see the comparison between the new data and our 70’s and 80’s data. Stay Tuned for Updates!
Featured Image: Crystal Instrument’s CoCo-80 Vibration Data Collector
Follow us:
Share this blog post:


